Introduction
(This article is a translation of the Japanese article titled "MiiTel AccountのSLO: 測定と継続的な最適化の方法")
I'm Kei Usami from RevComm. We develop and provide an AI-powered phone system "MiiTel" and an AI-powered online meeting analysis tool "MiiTel Meetings."
I work in the MiiTel authentication platform (MiiTel Account) team, serving as a Project Manager and Software Engineer.
Previous Articles:
- Cognito user pool で OpenID Connect を利用した外部 ID Provider によるサインインを実現する - RevComm Tech Blog
- Webアプリケーションの国際化対応をバックエンドからフロントエンドに移行した話 - RevComm Tech Blog
In this article, I'd like to introduce the measures we are taking to ensure the stable operation of the MiiTel Account service, while also discussing its relationship with SLO (Service Level Objectives).
SLO - What is it?
In a nutshell, SLO can be described as "objectives on service reliability." Generally, companies providing web services or systems strive to minimize disruptions in order to offer users a better experience. However, since systems are not infallible, occasional outages or system issues are inevitable.
This is where SLO comes into play.
SLO represents the quality objectives set by service providers (such as companies offering web services like MiiTel). It is based on the quality levels users can expect when using the service.
Actual SLOs are expressed as specific numerical values. For example, “guaranteeing 99.9% uptime” or “maintaining a response time of 2 seconds or less for 99.9% of all requests”. These metrics serve as indicators to assess how comfortably customers can use the service.
Related terms - SLI and SLA
SLI (Service Level Indicator) and SLA (Service Level Agreement) are closely related to SLO, and are also important concepts.
- SLI (Service Level Indicator): SLI is a specific and quantitative metric used to measure the performance and quality of a service. It includes metrics such as average response time and error rates.
- SLA (Service Level Agreement): SLA is a contract or agreement between the service provider and the customer. It typically specifies what quality metrics the service provider should meet and includes compensation arrangements in case the goals are not achieved.
- SLO (Service Level Objective): SLO is a quality target set based on SLIs. It defines the performance and quality of a service in specific numerical terms. While often used as an internal target, some services publicly disclose their SLOs.
In summary, SLI quantifies the state of a service, SLA defines the agreement between the service provider and the customer, and SLO sets the quality goals the service should achieve. These metrics are key to enhancing the reliability between service providers and customers.
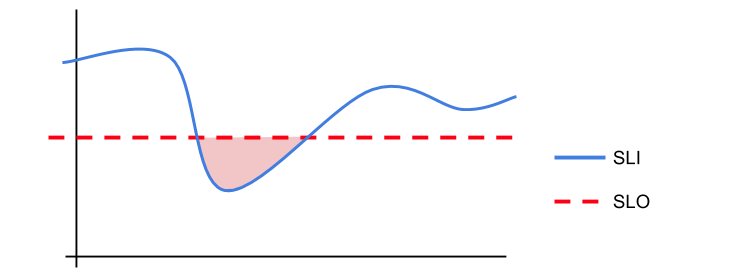
The difference between SLO and SLI is clearly illustrated on the Google Cloud website as follows:
Now, let's explore how MiiTel Account sets SLOs and what specific measures are being taken to achieve them.
Role of MiiTel Account
First, let me explain the role of MiiTel Account within MiiTel.
MiiTelの技術スタックとアーキテクチャ変遷を紹介します(2023年5月版) - RevComm Tech Blog
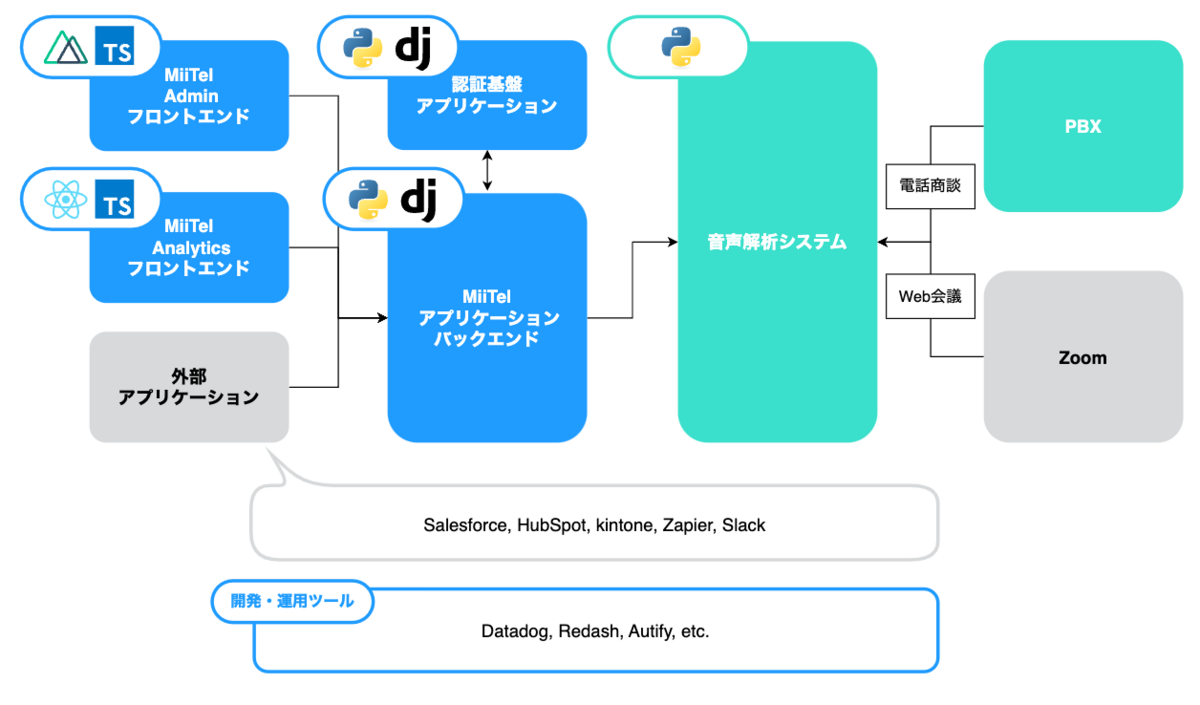
MiiTel Account corresponds to what was introduced as the "Authentication Infrastructure Application" in this article.
MiiTel Account handles the authentication functions for the entire MiiTel platform. If an issue were to occur with MiiTel Account, it would result in the inability to access any of the services that make up MiiTel.
Since MiiTel is used for calls and inbound interactions, even a few seconds of service downtime can have a significant impact on users. Therefore, it is a service that must operate robustly and stably above all else.
However, on the other hand, there is a dilemma between maintaining service stability and swiftly adding authentication-related features to meet business needs.
SLO provides a framework to effectively manage this. By setting higher SLOs than regular services, you can ensure stability while allowing for some aggressive feature development as long as the SLOs are met.
By formalizing goals through SLO and visualizing the current state of service performance and quality, you can somewhat alleviate the tension between stable operation and feature additions.
SLO in MiiTel Account
So, what SLOs are set for MiiTel Account in practice?
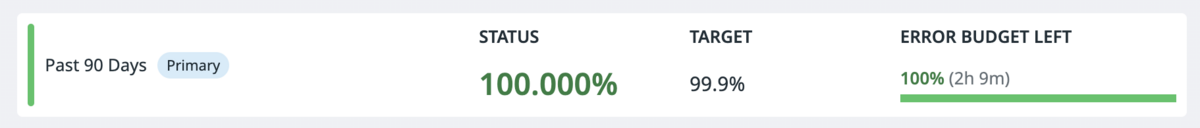
MiiTel utilizes Datadog as a monitoring tool and currently has the following target values set:
- The percentage of 5XX errors in the total request count should be within 0.2%.
- The average response time should be under 3 seconds.
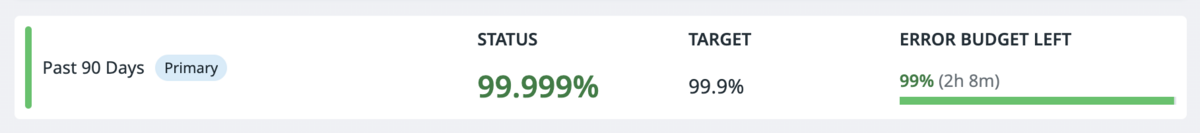
*Both of the above criteria should be met for 99.9% or more within the last 90 days.
These are quite strict numbers. However, as of October 2023, the error percentage exceeds 99.999%, and the response time is 100%, surpassing the targets.
With a considerable error budget, there is room for proactive feature development while maintaining the stability of the system.
Datadog is a valuable tool, particularly when combined with APM (Application Performance Monitoring) , as it makes setting and monitoring SLOs straightforward. It automatically calculates monitoring metrics and allows you to configure alerts according to your preferences, making it highly convenient.
Efforts Toward Achieving SLOs
To maintain SLOs, various initiatives and operational strategies are necessary. Here, I'll introduce some of the efforts within MiiTel Account.
Setting Various Metrics and Monitoring Alerts
One of the most effective and easy-to-implement measures is setting up metrics and monitoring alerts. While various tools can accomplish this, as mentioned earlier, RevComm utilizes Datadog as its monitoring tool.
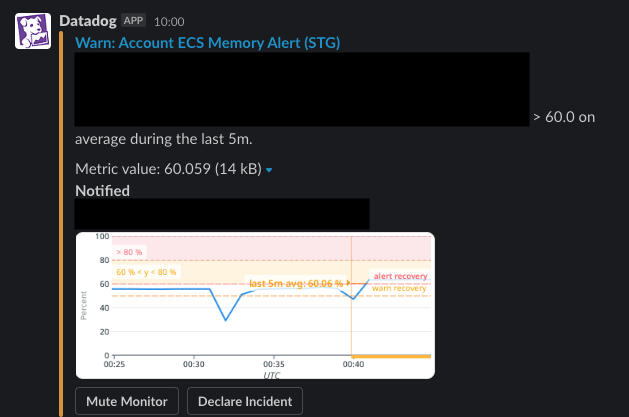
You can set thresholds to trigger alerts in cases where there are anomalies in request counts or when infrastructure metrics, such as those from AWS, are more critical than usual. These alerts can be configured to notify you via platforms like Slack.
Moreover, Datadog allows for creating simple scenarios to run end-to-end tests periodically, which can be used for health checks to ensure the login functionality is working correctly.
When setting up alerts, it's advisable to differentiate notification channels between production and non-production environments. This way, you can easily discern whether immediate attention is required, preventing development environment alerts from getting lost in the mix.
Regular Metric Checks in Meetings
The MiiTel Account team conducts bi-weekly meetings where they discuss task progress, share insights, and address concerns.
To foster constant awareness of SLOs and various metrics, the team begins each meeting by checking the SLO dashboard in Datadog.
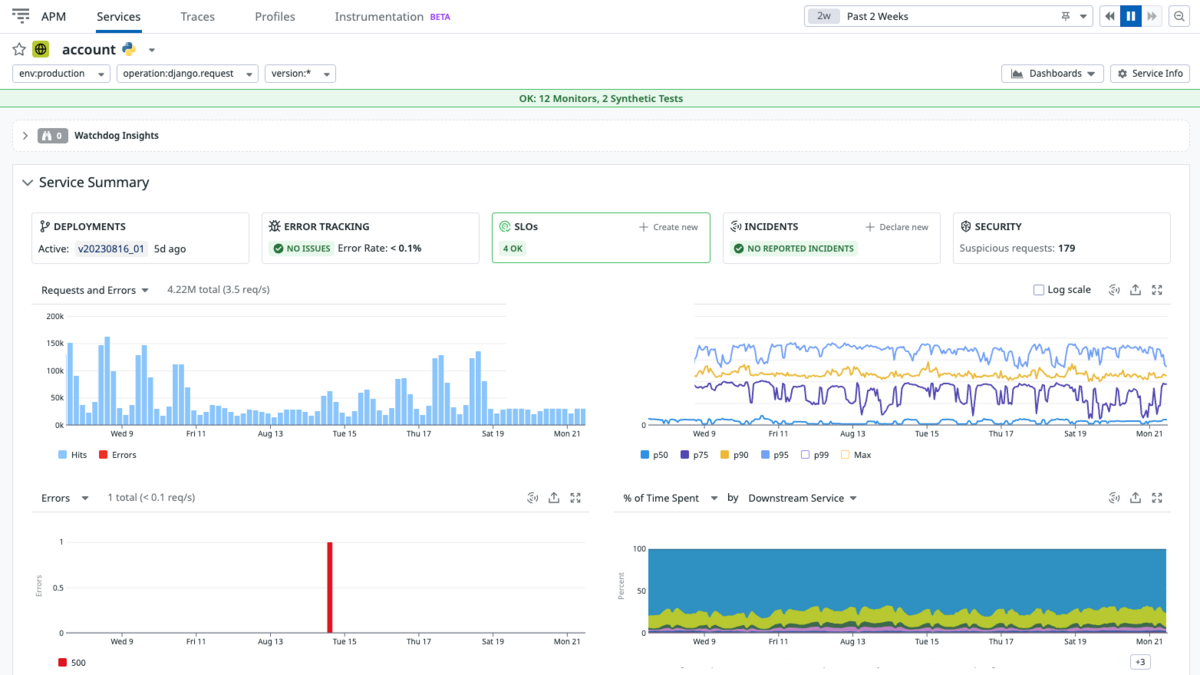
With Datadog APM set up, you can access dashboards that display time-series data for metrics like request counts, error rates, and latency. This is highly effective in understanding the current state of the service.
In some cases, analyzing the trends of request counts and response times for each API endpoint and using this data to consider effective measures for improvement may be necessary.
Sometimes, abnormalities are detected during these regular meetings.
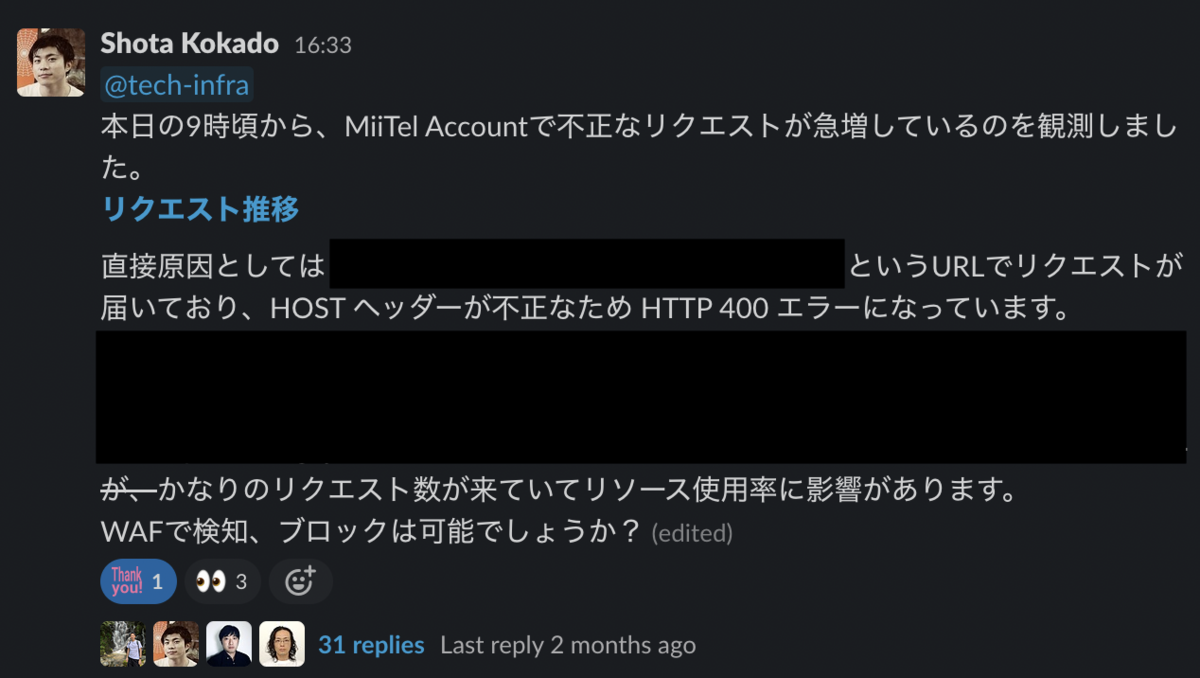
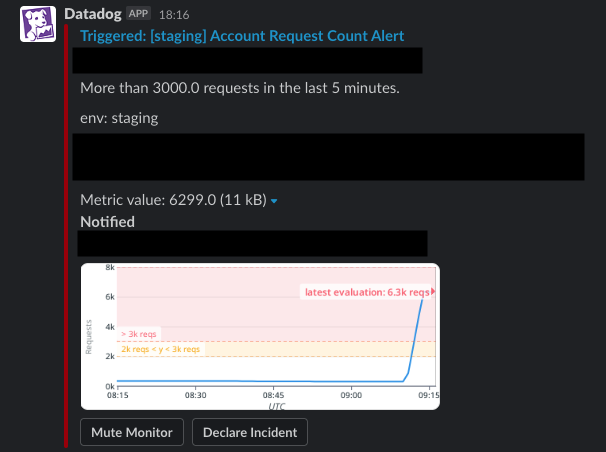
An example of this was noticed by Shota Kokado (@skokado, previous article: Amazon Inspectorによるプラットフォーム診断とコンテナイメージ改善の取り組み - RevComm Tech Blog), who has appeared in this blog on several occasions. At that time, request count alerts as mentioned earlier had not been set up.
However, during a routine dashboard check in a meeting, an abnormal tenfold increase in requests was observed.
Due to web server auto-scaling and other measures, there was no significant impact on the service, and the issue was resolved through the use of security features like WAF. If it hadn't been discovered promptly, there could have been potential service disruption due to resource constraints in the infrastructure.
Automation of Integration Tests and E2E Tests After Release
While enhancing monitoring and alerting is essential, most incidents tend to occur shortly after a release. There might also be bugs that are only noticeable when working with the actual environment and database, as unit tests can't detect them.
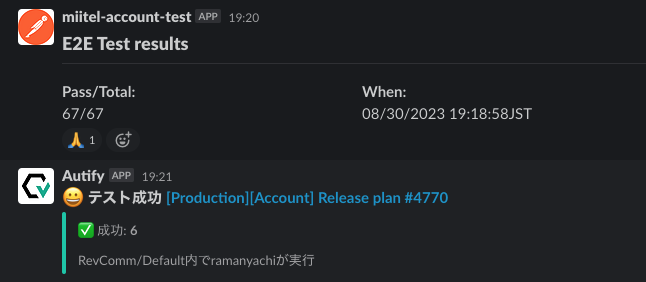
To mitigate these risks, MiiTel Account has automated API integration tests and E2E tests to run after a release. These tests are configured for each environment (we have three major environments), allowing them to check for any unexpected bugs before a production release.
- Integration Tests: Comprehensive testing of nearly all API endpoints for normal operation.
- E2E Tests: UI tests for critical functionality using Autify.
Upon completion of these tests, notifications are sent to Slack as follows:
The automation framework for tasks like these has been developed by Raman Yachi (@r-ym). He has recently summarized the details in a blog post, which you can refer to for more in-depth information.
- E2E Testing system for MiiTel Account - RevComm Tech Blog (English)
- MiiTel AccountチームのE2Eテスト自動化 - RevComm Tech Blog (日本語)
Thanks to this system, which significantly reduces the need for manual testing, releases can now be carried out with greater safety and reduced psychological burden.
These tests have significantly enhanced the service's security, allowing the team to transition from weekly night releases to releasing during the day whenever necessary.
Deployment frequency is an important metric, especially emphasized in the Four Key Metrics of DevOps Research and Assessment (DORA), so this initiative holds significance not only in terms of SLOs but also in improving development productivity.
Looking Ahead
Thanks to these measures, we've been fortunate to achieve SLOs and maintain a higher level of metrics.
While operating a web system, it's inevitable that there will be occasional disruptions and temporary drops in service performance. However, with the strategies mentioned earlier, you can control this risk and maintain high productivity while continuing to develop new features.
Looking ahead, the goal is to not only maintain SLOs but also enrich the metrics for more detailed service health checks and enhance development productivity.